
Financial Highlights
Consolidated Financial Results
Consolidated Balance Sheets
1st Quarter2nd Quarter3rd QuarterFull Year
Gross profit
Net business profit
Ordinary profit
Profit attributable to owners of parent
Total assets
Loans and bills discounted
Deposits
Common Equity Tier 1 capital ratio
(unit:JYP billion)
(unit:JYP billion)
(unit:JYP billion)
(unit:JYP billion)
(unit:JYP trillion)
(unit:JYP trillion)
(unit:JYP trillion)
(unit:%)
(unit:JYP billion)
(unit:JYP billion)
(unit:JYP billion)
(unit:JYP billion)
(unit:JYP trillion)
(unit:JYP trillion)
(unit:JYP trillion)
(unit:%)
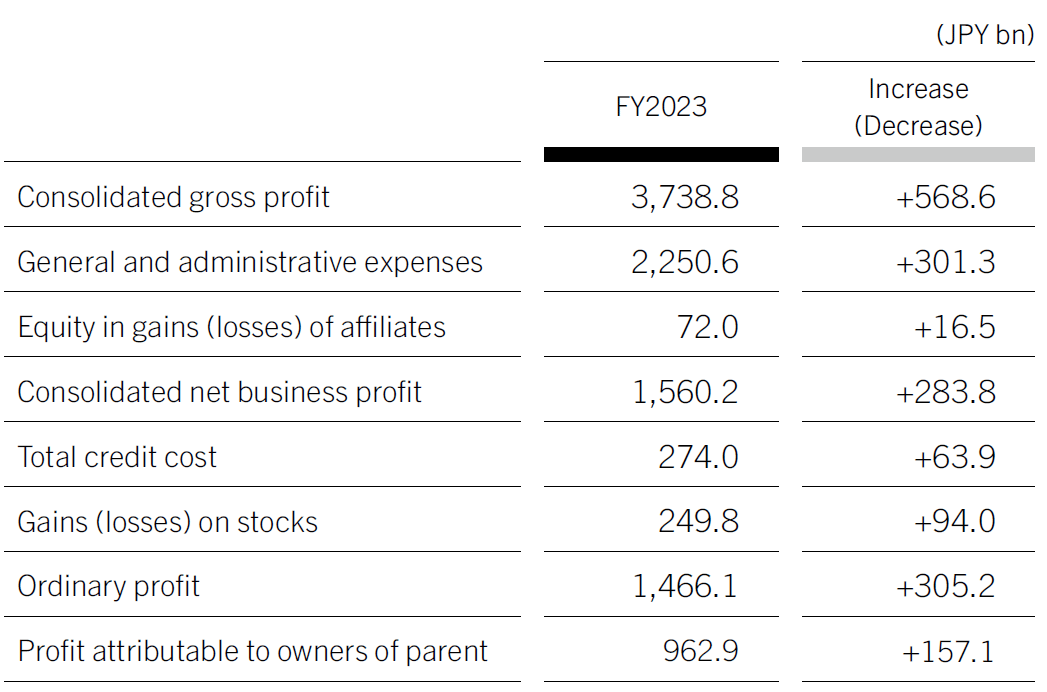
Consolidated Income Analysis Summary
Consolidated gross profit increased by ¥568.6 billion year-on-year to ¥3,738.8 billion due to increased profit of all Business Units resulted from an increase in domestic and overseas loans and ancillary businesses, recovery of SMBC Nikko Securities, and strong performance in the payment business, in addition to positive business environment including the depreciation of the yen and higher U.S. interest rates.
General and administrative expenses increased by ¥301.3 billion year-on-year to ¥2,250.6 billion due to effects of the depreciation of yen and inflation, higher variable marketing cost at Sumitomo Mitsui Card Company, etc., and upfront investment for future growth.
Total credit cost increased by ¥63.9 billion year-on-year to ¥274 billion due to business expansion of domestic and overseas retail subsidiaries, increased provisions for large obligors in the fourth quarter, and the recording of forward-looking provisions based on anticipated environmental changes.
Profit attributable to owners of parent increased by ¥157.1 billion year-on-year to ¥962.9 billion due to increase of gains on stocks as a result of accelerating the sale of equity holdings under a strong stock market.
By making steady progress with our business strategy in additon to a strong business environment, we achieved record high consolidated gross profit, consolidated net business profit, and profit attributable to owners of parent.
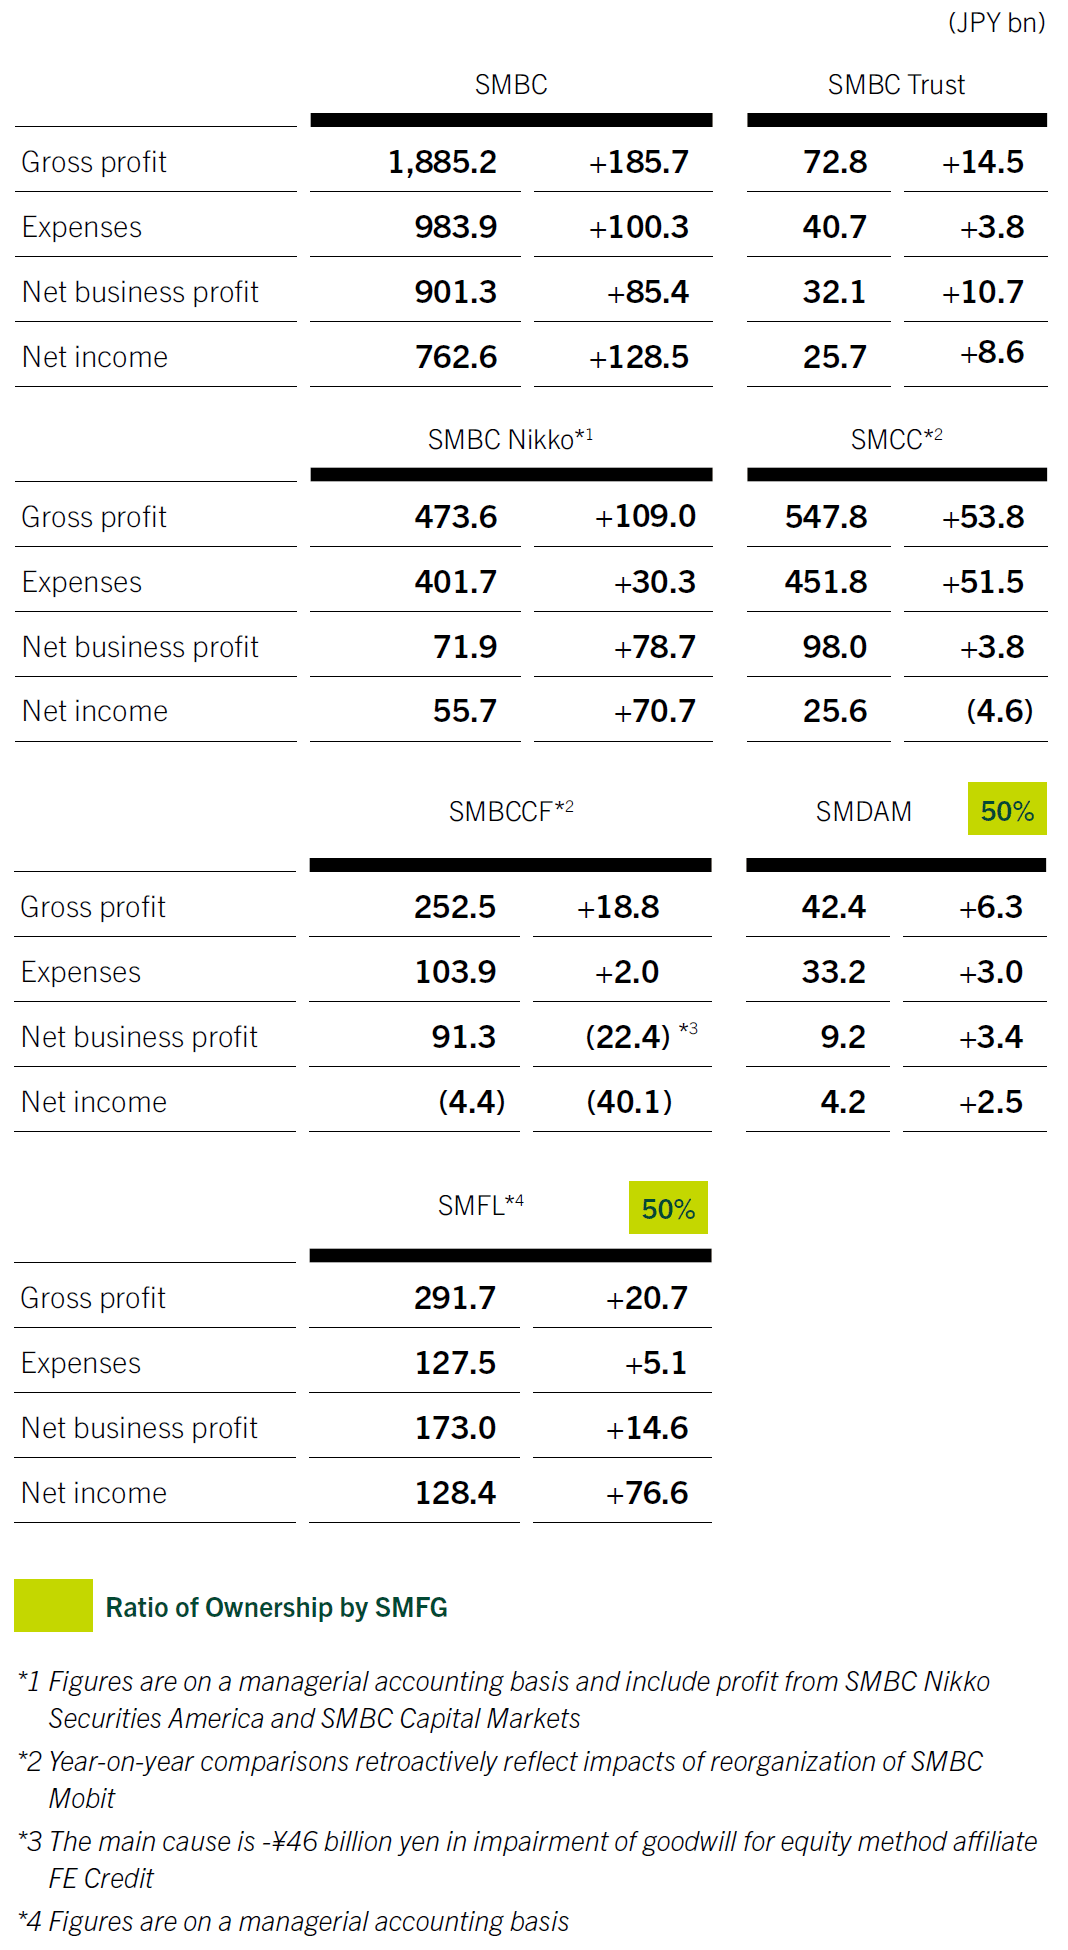
Performance of Major Group Companies(Left: FY2023 performance; Right: Year-on-year comparison)
Consolidated Balance Sheet Summary
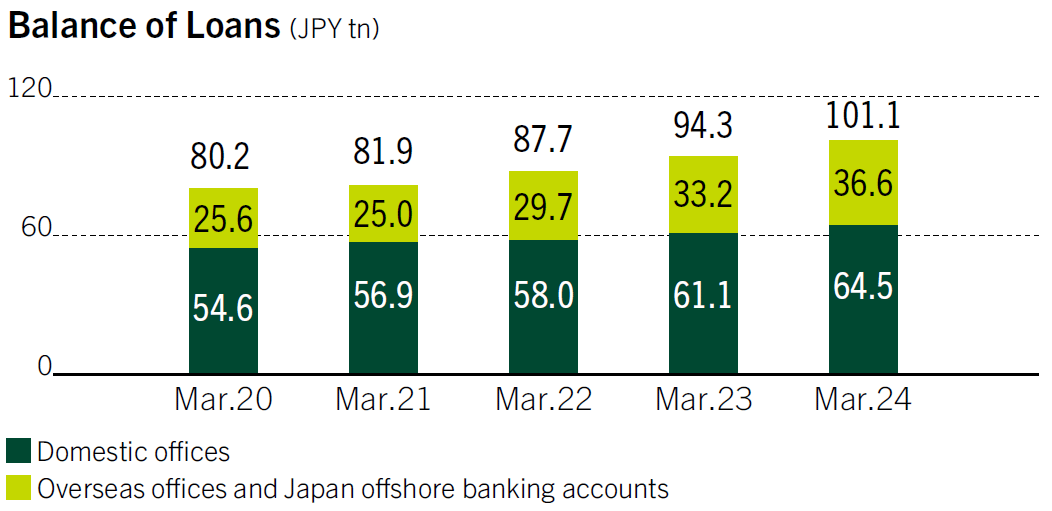
Loans and Bills Discounted (SMBC, non-consolidated)
Total balances increased by ¥6.8 trillion year-on-year to ¥101.1 trillion. The increase was primarily due to capturing demand for funds driven by the revitalization of corporate activities in Japan and increased overseas balance under depreciation of the yen.
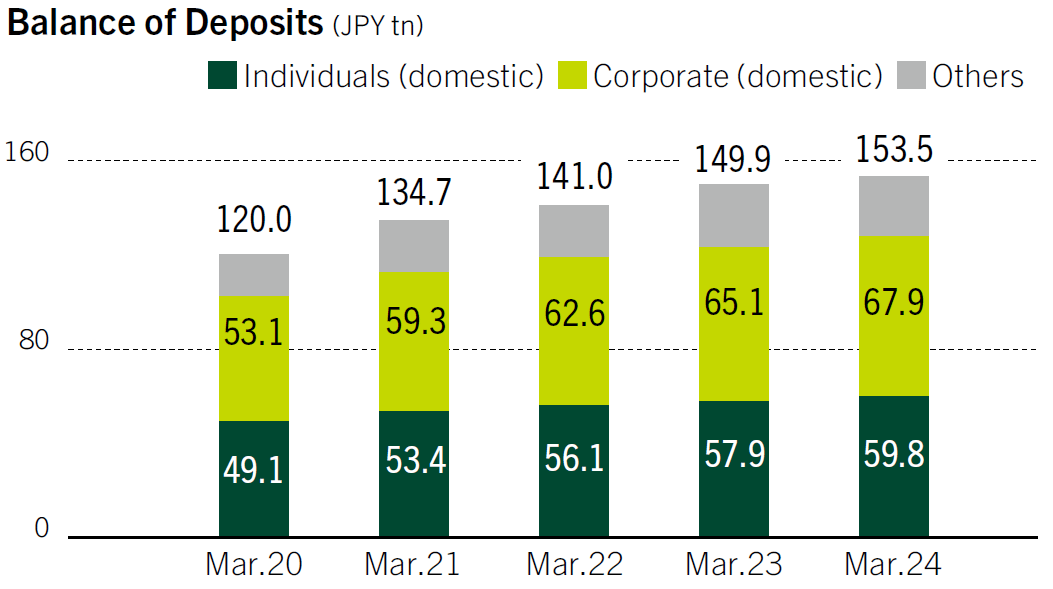
Deposits (SMBC, non-consolidated)
Deposits increased by ¥3.5 trillion year-on-year to ¥153.5 trillion, primarily due to increases in both individuals and corporate deposits in Japan.
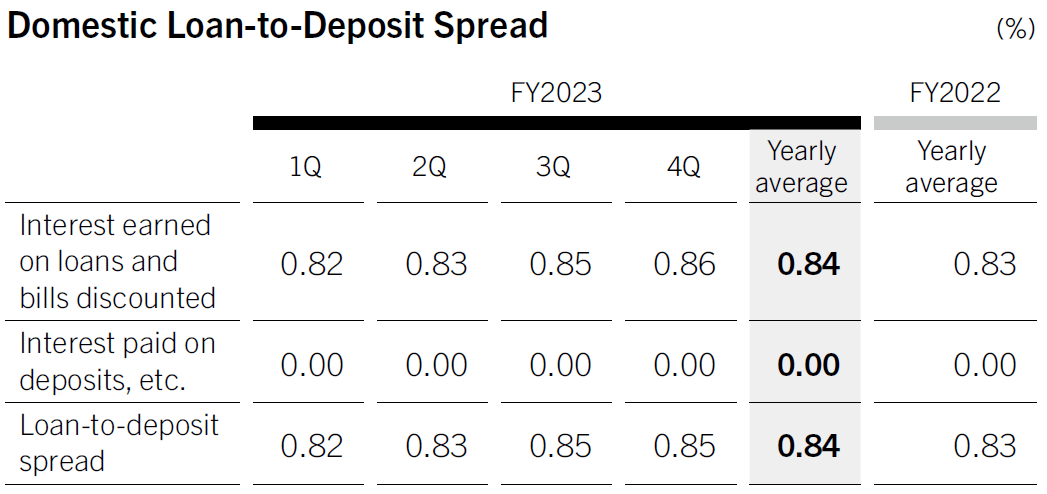
Domestic Loan-to-Deposit Spread (SMBC, non-consolidated)
The domestic loan-to-deposit spread, calculated by subtracting the value of deposits from the value of loans, rose by 0.01% year-on-year to 0.84%.
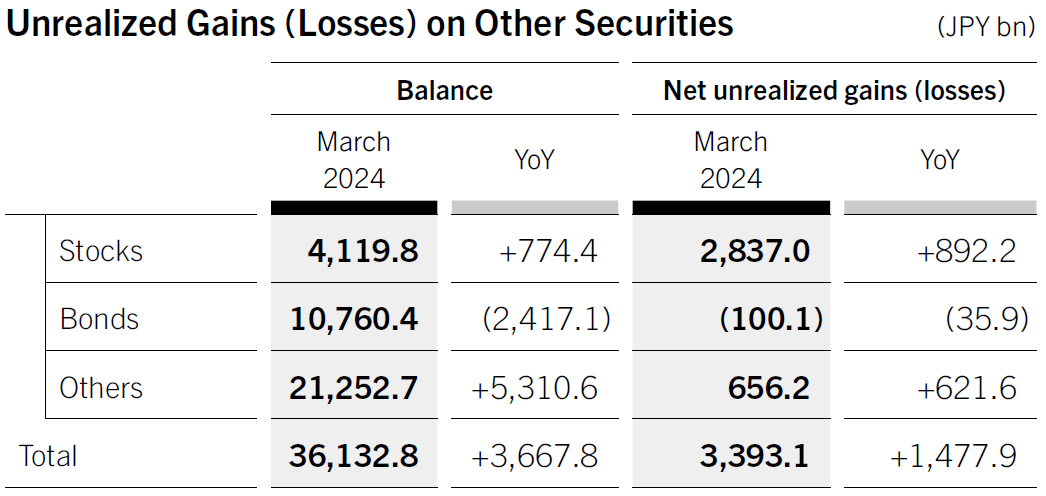
Securities
Other securities increased by ¥3,667.8 billion year-on-year to ¥36,132.8 billion mainly due to increase in the balance of both foreign bonds by depreciation of the yen and stocks under a strong stock market, while decrease in the balance of Japanese government bonds required to be held by SMBC. Net unrealized gains increased by ¥1,477.9 billion year-on-year to ¥3,393.1 billion, primarily due to higher unrealized gains of stocks associated with higher stock prices.
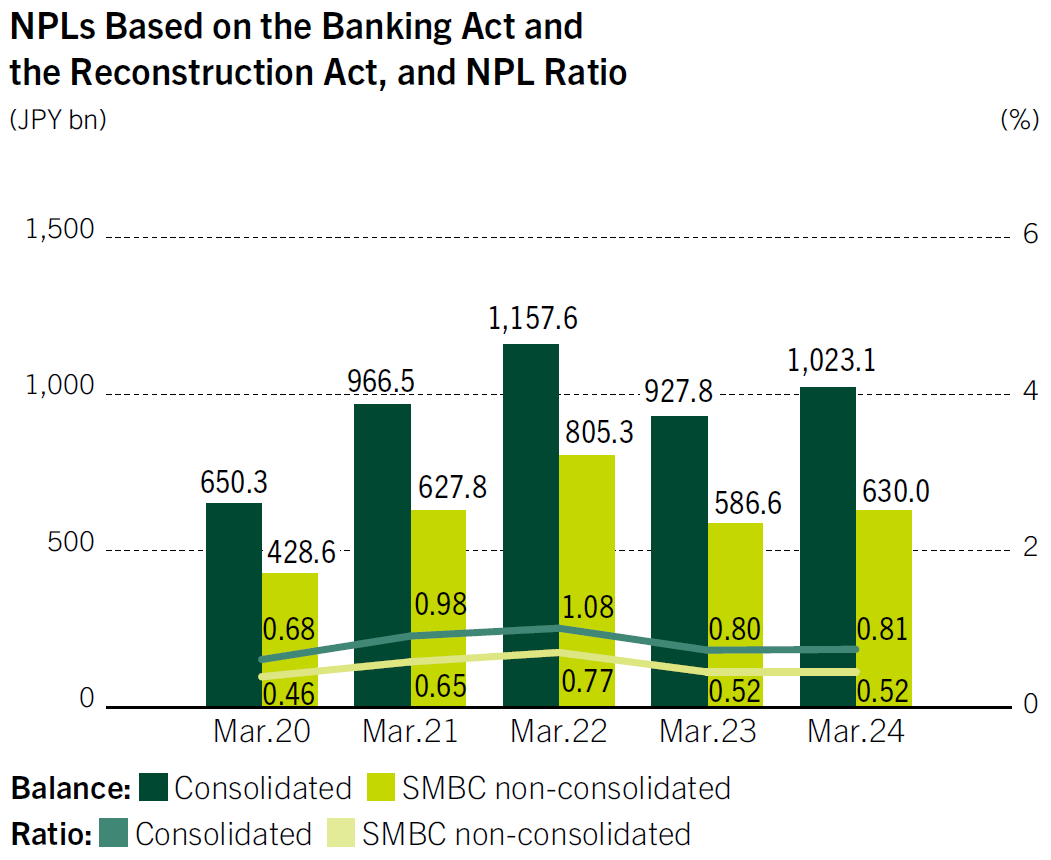
NPLs Based on the Banking Act and the Reconstruction Act
The balance of NPLs based on the Banking Act and the Reconstruction Act increased by ¥95.3 billion year-on-year to ¥1,023.1 billion primarily due to balance fluctuations of large obligors. The NPL ratio also increased by 0.01% year-on- year to 0.81%.
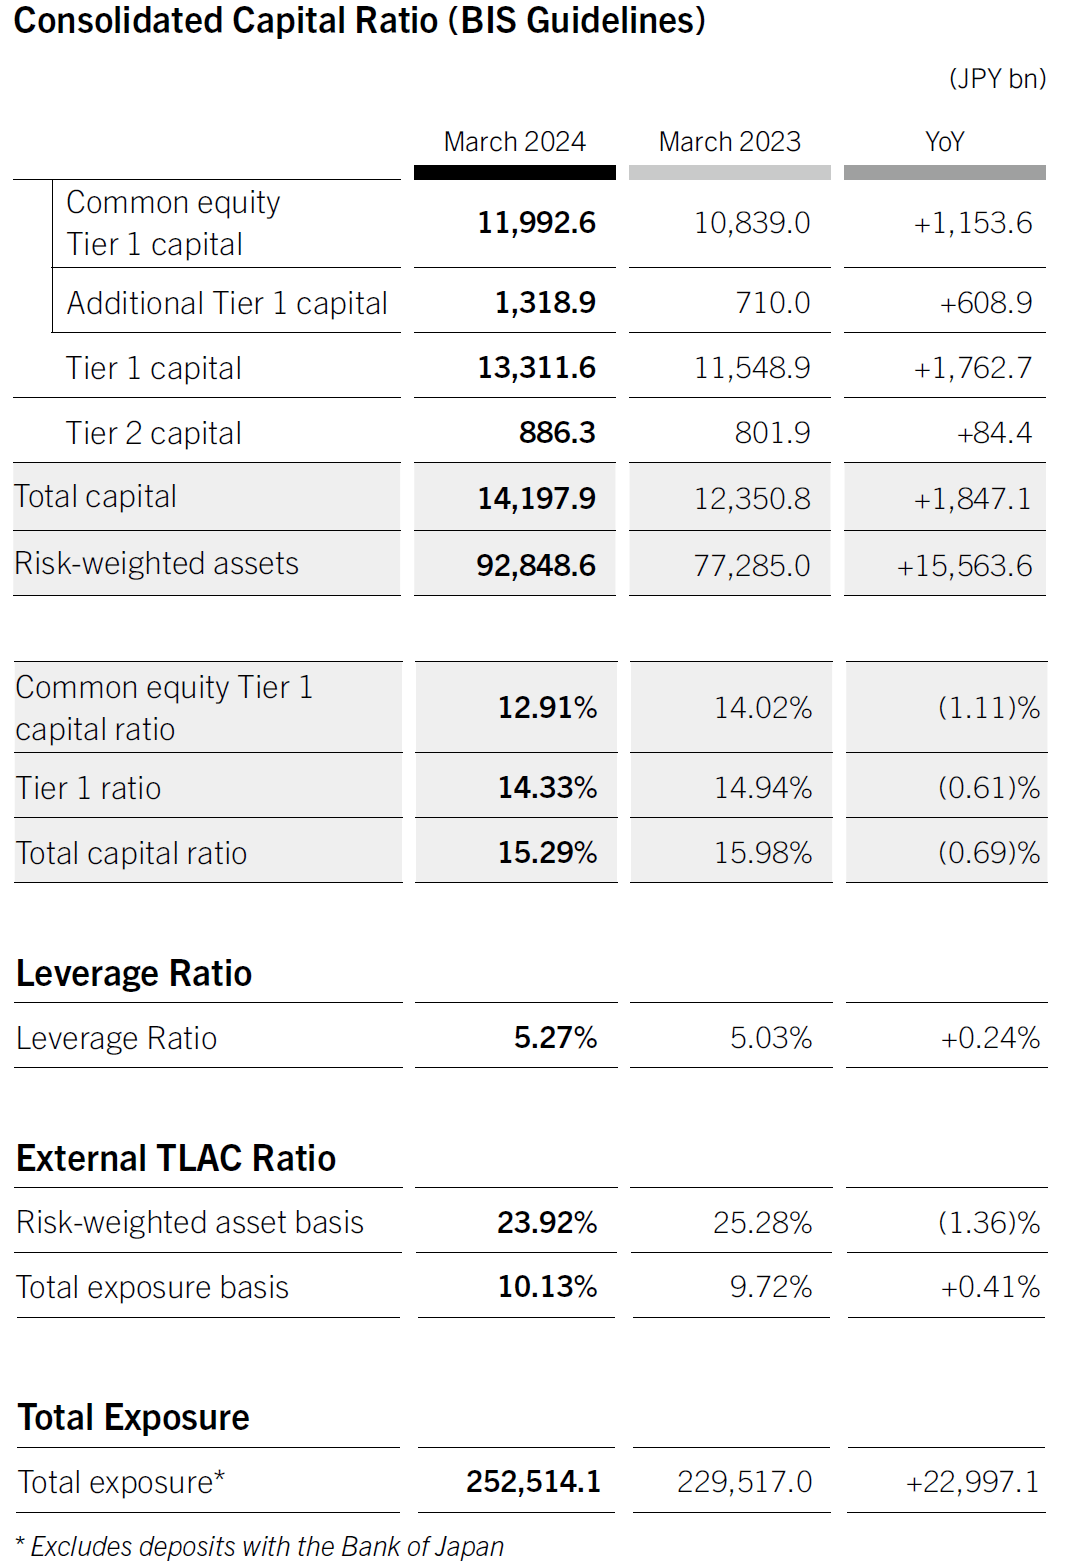
Capital
Capital
Common equity Tier 1 capital increased by ¥1,153.6 billion year-on-year to ¥11,992.6 billion, primarily due to an increase in net unrealized gain on equity holdings associated with higher stock prices. Tier 1 capital increased by ¥1,762.7 billion year-on-year to ¥13,311.6 billion and total capital increased by ¥1,847.1 billion year-on-year to ¥14,197.9 billion mainly due to issuance of Additional Tier1 bonds.
Risk-Weighted Assets
Risk-weighted assets increased by ¥15,563.6 billion year-on-year to ¥92,848.6 billion, mainly due to the start of phased implementation towards Basel III finalization from the end of March 2024, in addition to increase in lending in domestic and overseas.
Capital Ratio
As a result of the above, the Common Equity Tier 1 capital ratio, which represents the most important form of core capital, stood at 12.91%, while the total capital ratio was 15.29%. Both ratios remain adequate.
Leverage Ratio
Due to the increase in Tier 1 capital, the leverage ratio increased by 0.24% year-on-year to 5.27%.
External TLAC Ratio
In addition to increasing our own equity capital, SMBC Group strives to increase external TLAC capital by procuring external TLAC bonds primarily from overseas corporate bond markets. The external TLAC ratio was 23.92% on a risk-weighted asset basis and 10.13% on a total exposure basis, meeting mandated levels for both.